Our BI dashboards provide complete supply chain visibility across all modes. With FreightOptics’ advanced technology, you can easily view all of your data in one central hub, accessible from anywhere with an internet connection.
Our system offers 50+ customizable, exportable dashlets with incredibly precise drill-down capabilities, as well as sophisticated reporting options. With one-login access to our web-based platform, you’ll have 24/7 visibility to your entire supply chain, on any device.
It’s your data, exactly what you want to see, when you want to see it.
Maps, Charts, and More
Our Report Module offers 70 customizable reports that can be saved, scheduled, or run ad hoc, and sent directly to you or your team’s inboxes. Receive only the data you wish to see, sent on your terms and on your schedule.
Sample Features:
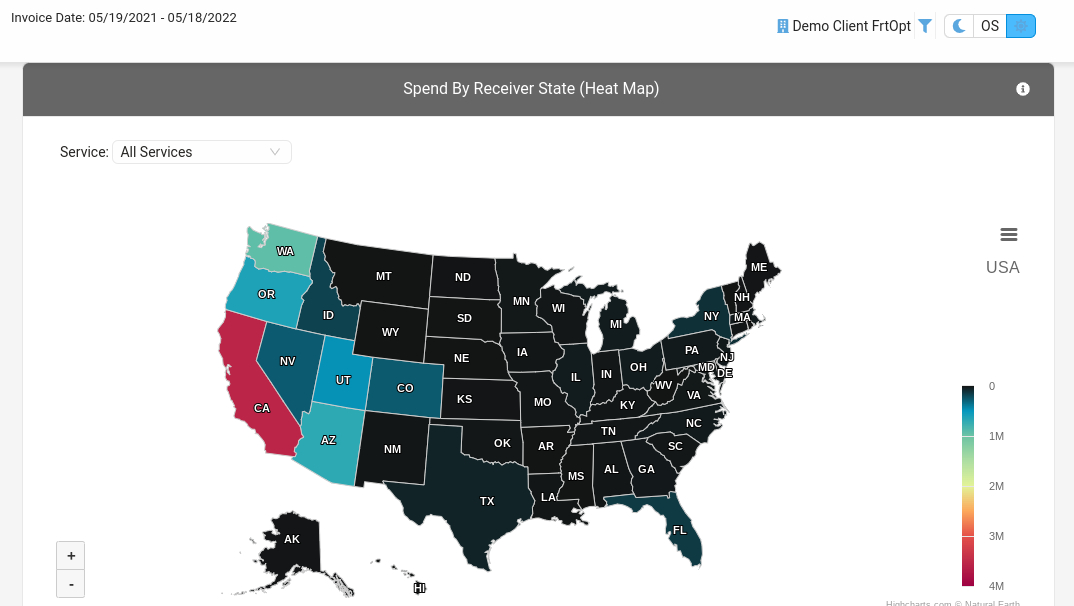
Heat Maps
Drill-downs to the county level
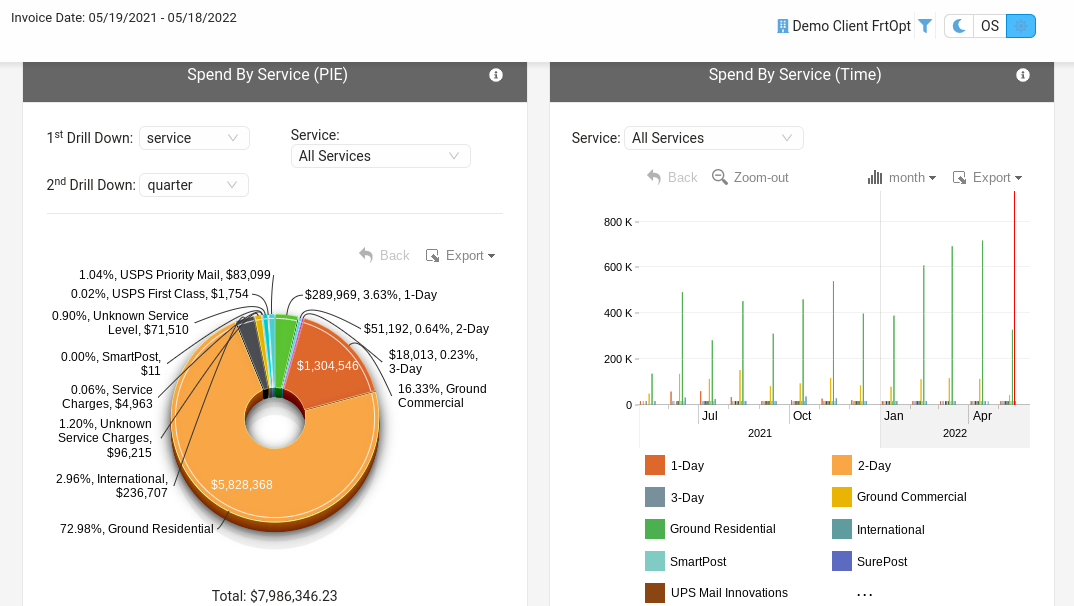
Drill-downs to the week and day
Pie Chart drill-downs
Edit Layout features
Dashlets, exportable for an executive presentation
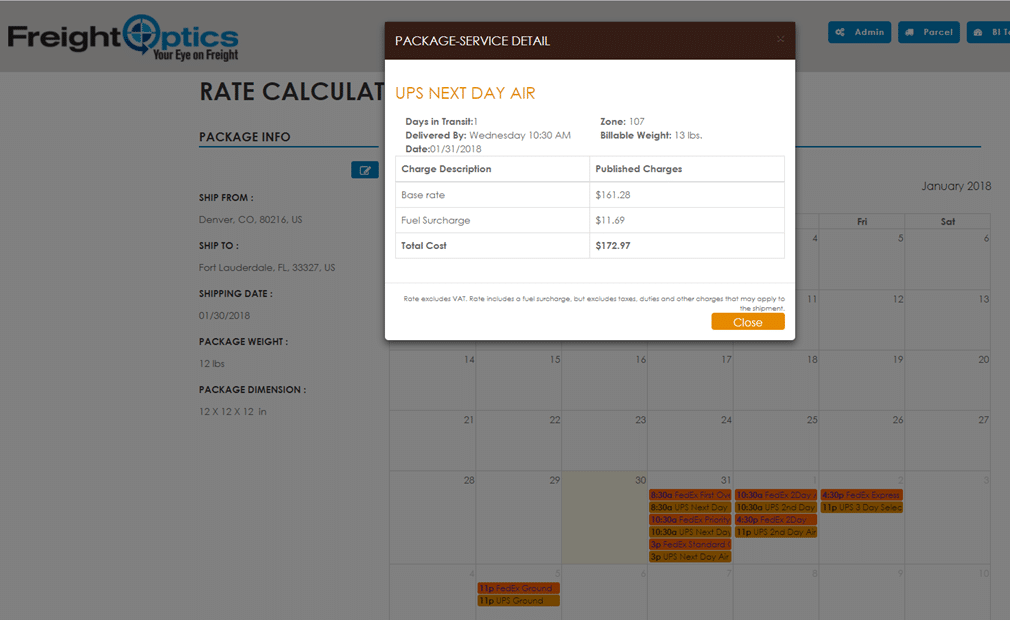
Use our Rate Calculator tool to determine the optimal service based on cost and transit time, with full integration to your rate agreements. This tool is also very valuable to customer service teams trying to help their customers understand the costs of different services and delivery times.