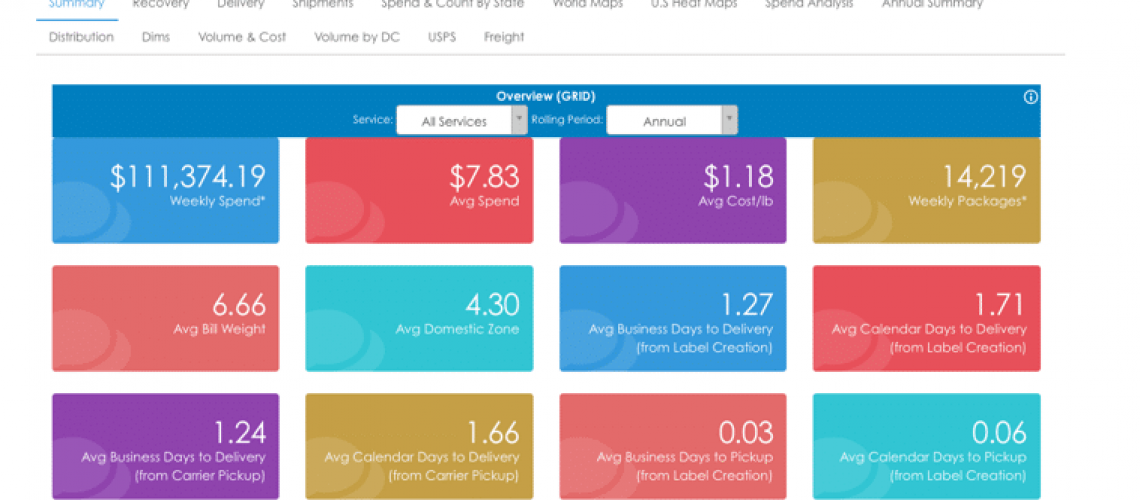
With FreightOptics technology, there are many features in the dashboard to explore for maximum supply chain visibility. With our supply chain technology, you can drill down to the month, week, day, service, state, city, county, and more. But what about when you just want to get a snapshot of your activity?
We have the answer for that! The Summary page.
On the Summary page, you’ll get a quick look at a colorful Overview Grid of your data by Service (including 1-Day, 2-Day, 3-Day, Ground Commercial, Ground Residential, International, SmartPost, SurePost, UPS Mail Innovations, Newgistics Parcel, and Others). You can also sort your Rolling Period by recent weeks, months, quarters (current or previous), annual, YTD, or select custom dates.
From this Dashboard page, you’ll have a comprehensive snapshot of spend (both weekly and average – including small parcel spend), number of packages, days to delivery, and so much more.
Login from anywhere with an internet connection to access your Summary Dashboard. With our supply chain solutions, you’ll always be informed.
Want to learn more about what FreightOptics can do? Contact us for a free demo of our top logistics technology today!


